Sunday, December 11, 2022

FINPIPE & HIKAL में इनवेस्ट करो और WAIT करो..!

We found two stocks that are looking good for investment purposes. Both have shown reversal signals on the long-term chart and the fundamentals are good. Let’s discuss this in detail.

FINPIPE: Finolex Industries Limited (FIL) is a leading manufacturer of PVC Resin and the largest producer of PVC Pipes & Fittings in India. The Company offers the latest range of superior quality and durable PVC-U pipes and fittings used in agriculture, construction, and industrial operations. The company is almost debt free and net profits are increasing. The company is focusing on business expansion. Sales growth is increasing and FIIs are also increasing stake. Overall business module and financials are strong.

As per history stock price has corrected 50% from the lifetime high. Now it has given a breakout to consolidation and RSI showing positive divergence. Current levels are good and there is no immediate hurdle on the chart. We are bullish from these levels and expecting 200/220 levels. Immediate support is around 165/155.


HIKAL: Hikal is a partner to companies in the Pharmaceuticals, Crop Protection, and Specialty Chemicals industries. The company is in the business of supplying research services, active ingredients, and intermediates for its customers. Hikal's manufacturing facilities have been inspected and approved by leading multinational companies in the Crop Protection and Pharmaceutical sectors.

This stock has also shown the same chart structure and given Cup & Handle breakout after the rest of 7-8 weeks. Share is ready for Higher High and Higher Low, we are expecting 450/500. Immediate support is around 350/300.


-------------------------------------------------------------------------------------------------------------------

Disclaimer: The contents produced here are purely for educational purposes. They should not be construed as buy/sell recommendations. I am not a SEBI registered Analyst or Investment Advisor. Readers are advised to consult their Investment advisor before taking any decisions based on the above write-up.


Sunday, November 20, 2022

MARKSANS PHARMA BUY करो और HOLD करो..!

In the last write up we caught bank stock [Bank Of Maharashtra] and that doing well as per our expectations. Now we have found one more stock from the pharma sector which is Marksans Pharma Ltd. Marksans Pharma is engaged in the business of formulation of pharmaceutical products. Their key focus areas lie in the OTC & prescription drugs that have wide-ranging applications across fields like Oncology, Gastroenterology, Antidiabetic, Antibiotics, Cardiovascular, Pain Management, and Gynaecology, among others. UK & US are their largest customers contributing 42% & 43% respectively out of 25+ countries. The company aims to reach 2000 Cr. revenue in the next few years.

Chart Outlook: After the first lockdown stock price has risen from 10 and touched 98 i.e. almost 10 times. Again stock price come down to 40 and gave a reversal signal on the major time frames chart. On the monthly chart stock price is making Inverse H&S that is the trend change signal. On the weekly chart, the price has given a breakout to its down trendline. So we are expecting 20-30% up moves from the current levels for the medium to long term.


Fundamental Outlook:

1.      The company is almost debt free.

2.      Yearly net profits are increasing.

3.      The company is focusing on business expansion.

4.      It has a good cash flow.

5.      FIIs and DIIs are gradually increasing their holdings.

6.      Return on equity is around 20%.

If look at the product of the company then those are the demanding. Based on these all parameters we are bullish on the stock.

Telegram: https://t.me/Intraday_King

-------------------------------------------------------------------------------------------------------------------

Disclaimer: The contents produced here are purely for educational purposes. They should not be construed as buy/sell recommendations. I am not a SEBI registered Analyst or Investment Advisor. Readers are advised to consult their Investment advisor before taking any decisions based on the above write-up.

Monday, October 24, 2022

Bank Of Maharashtra Ready To Give 50% Profit | Diwali 2022

In the last month, RBI policy has been declared and the repo rate increased by 0.5. Increasing the repo rate is a plus point for banks and NBFCs. Due to inflation RBI can increase repo in the future so I am bullish on banking and financial stocks. When we look at the banking sector then most of people prefer private banks because they are strong as per valuation, service, and profits. However, as retail investors our focus is on small-price shares. Keeping this point in mind I found one PSU bank which is looking good on chart and fundamentals.

Weekly Chart: Bank of Maharashtra made a high of 32 in June 2021 and started to fall from that point. After showing a 50% correction and it touched a level of 15. Now share price is showing some strength for the upside. Recently, on the weekly time frame stock has broken its resistance of 18.90 and confirmed Inverted H&S. Inverted H&S is trend reversal confirmation and as per my view, this breakout happened due to Big Bulls. The current share price is around 19.80 and I am bullish from current levels. I am expecting up moves till 22-23 if the stock crosses these levels then it can show 30-35.


The company has a market capital of around 13300 Cr. and quarterly net profits are increasing. From last 3 years, net profits are increasing so the company is doing well. The company is focusing on business expansion which is a plus point for us. Also, the promoter has 91% share holding.


Telegram: https://t.me/Intraday_King

-------------------------------------------------------------------------------------------------------------------

Disclaimer: The contents produced here are purely for educational purposes. They should not be construed as buy/sell recommendations. I am not a SEBI registered Analyst or Investment Advisor. Readers are advised to consult their Investment advisor before taking any decisions based on the above write-up.

Saturday, August 27, 2022

Nifty Is Ready For 16800..? | Market Outlook

In the last write up we discussed Nifty levels and it has reacted the same. We have seen good profit booking after touched to 17792. More profit booking can come ahead? I think yes, because of the global markets. In this last trading session, the American market has shown a big fall and closed at a day low. Dow Jones has given a breakdown to the trend line and confirmed Head & Shoulder. This is trend change confirmation and it is on the daily chart so the short-term trend will be down. American market impacts our market so we can see more correction in our market. Let's see the chart analysis of our index.


Nifty Weekly Chart: On a medium-term time frame Nifty has made Spinning Top but the lower leg is big which means the Bulls are active at the bottom. As per the options data, there are important support levels are 17500/17400. If the Nifty breaks these levels then the next support zone is around 17800/17600.


Nifty Daily Chart: Nifty has made bottom near 15300 and shown non-stop rally till the 18000. Now it is in the mood of profit taking and global clues are supporting. It has corrected almost 700 points in the last week. However, the American markets are not supportive so we can see more fall in our market. Also, on the daily chart, it has made Inverse Cup & Handle which is the signal of a trend change. We have to wait for confirmation and our trend will change for the short term. From the last three trading sessions, the Nifty is taking support from 20 DMA. If it breaks & closes below 17400 then we can see 17000 i.e. 200 DMA or on a breakout of 18000 we can see a new lifetime high. So be ready for both sides and stick to large-cap stocks only. SGX Nifty closed above 17400 and given respect to immediate support.


Telegram: https://t.me/Intraday_King

-------------------------------------------------------------------------------------------------------------------

Disclaimer: The contents produced here are purely for educational purposes. They should not be construed as buy/sell recommendations. I am not a SEBI registered Analyst or Investment Advisor. Readers are advised to consult their Investment advisor before taking any decisions based on the above write-up.

Sunday, August 21, 2022

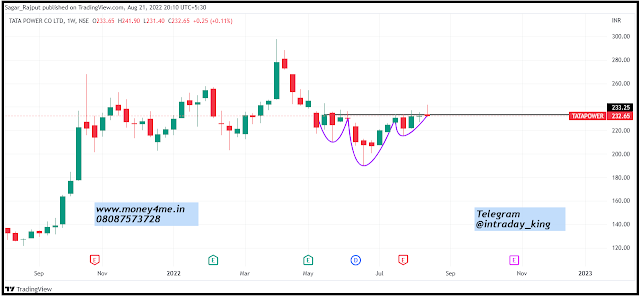
Does TATA POWER Have Power Of Up Moves?

TATA Naam hi kafi hai, in the last write up we had discussed TATA STEEL and it is working well. All Tata groups stocks are performing well and now Tata Power is looking good on charts. It has charging station contracts in two states. They can get more in the future, that is the reason we are bullish on it.

Monthly Chart: On the longer time frame stock is trading in a range from last 11 months and the range is 200 to 250. We can say it is making Flag and we have to wait for a breakout. If it gives breakout to 250 then it will touch 300 or more. Long-term investors can long from the current levels and immediate support is 200.


Weekly Chart: The stock price has taken fourth time support from 200 levels. Currently, it has made an Inverted Head & Shoulder that is the signal of a trend change. We are waiting for confirmation then we will enter in it for the medium term. Immediate support is around 220 and resistance is around 250.


Fundamental: Tata Power is in the business of Power Generation, Transmission, Solar roof manufacturing, and EV charging station. These business lines are good and demandable in the future. The company is profit making and they are focusing on business expansion. The company has good cash flow and the promoter has increased their shares holding by 10% in September 2020. Return on equity is around 8.5% and they are paying a heavy dividend.


Telegram: https://t.me/Intraday_King

-------------------------------------------------------------------------------------------------------------------

Disclaimer: The contents produced here are purely for educational purposes. They should not be construed as buy/sell recommendations. I am not a SEBI registered Analyst or Investment Advisor. Readers are advised to consult their Investment advisor before taking any decisions based on the above write-up.

Sunday, August 7, 2022

Tata Steel Now Just In 100 Rupees, Can We Buy?

Friends, today we are going to discuss one of the leading and trusted company that is TATA STEEL Ltd. Recently the company has split the share by 1:10 and increased share quantities. The share price was around 980 and it started to trade at around 98 rupees. Now new long-term investors will attract to this price and start to invest in it. As per our view, current levels are good for investors, let's focus on technical charts and fundamentals.

Monthly Chart: On the major time frame price is trading in a downtrend and continuing the downward channel as shown in the below chart. However, if we compare the last two weeks candle then there is a Bullish Engulf that has been confirmed. That is a good sign for up moves, the stock currently trading near the resistance of 108-110. Once it crosses then we will see the levels of 120/122 in a few days. Still stock price needs to break channel for big up moves.


Weekly Chart: After taking the rest of 4 weeks stock price has shown a good rally in the last week and confirmed Morning Star. Before going up we are expecting some profit booking then it will go up. If the price comes down near 100 then it will be a good opportunity to accumulate the shares.

Fundamental: The company has a presence across the entire value chain of steel manufacturing from mining and processing iron ore and coal to producing and distributing finished products. The business line is good and products are demanding in the future.

  • The company is on the second rank in the steel sector.
  • Net profits are increasing quarterly & yearly.
  • The company is increasing its assets.
  • The cash flow is very strong.
  • 75% of shareholders are Promoters, FIIs, and DIIs.
  • Return on equity is around 42%.
  • Stock is providing a good dividend yield of 4.75%.


Telegram: https://t.me/Intraday_King

-------------------------------------------------------------------------------------------------------------------

Disclaimer: The contents produced here are purely for educational purposes. They should not be construed as buy/sell recommendations. I am not a SEBI registered Analyst or Investment Advisor. Readers are advised to consult their Investment advisor before taking any decisions based on the above write-up.

Sunday, July 17, 2022

NIFTY Filled The Gap, Now Ready For 16700..!

Friends, before going to chart analysis need to take an overview of global clues. The Russia-Ukraine crisis is cooling off and parallelly commodity prices are coming down. USDINR hitting a lifetime high, but the CRUDE price is under control. FIIs are not ready to stop their selling however DIIs defending the same. Some are positive and a few are negative things going on. That is the reason market is volatile in day trading. If we look for positional then the market is positive and made a bottom in short term. The reason is commodity prices are cooling off.

NIFTY 50: Index was in a downtrend from April 2022, falling from 18000 to 15200. Before the 5-6 trading session it has given breakout to important resistance of 15900 and went up to 16250. These 15900 to 16250 ranges were gap down and as expected Nifty shown profit booking from the same levels. Recently it has tested its support 15900 and confirmed a new Higher Low. Now Nifty is again ready for 16250 with short-term support of 15800. For 16500/16700 need cross levels of 16250 then we will see rapid moves.


We have discussed the chart, if we look at the weekly option chain then data looking for both sides. On the call side long build-up happened till 16500 which means option buyers are bullish. On the other hand, all nearest put premiums show a short build-up that is also a bullish signal.


Overall market looking positive as per fundamentals, chart, and options data.

BANKNIFTY: The index showing strength but needs to cross important levels of 35500/35800 for more up moves. It is still trading in a downtrend. As per the weekly options data trend is not clear as both sides are a short build-up done. We have to wait for a breakout and clear trend as per option data.


Telegram: https://t.me/Intraday_King

-------------------------------------------------------------------------------------------------------------------

Disclaimer: The contents produced here are purely for educational purposes. They should not be construed as buy/sell recommendations. I am not a SEBI registered Analyst or Investment Advisor. Readers are advised to consult their Investment advisor before taking any decisions based on the above write-up.