Sunday, March 20, 2022

What Is The Next Step Of NIFTY & BANKNIFTY?

From the start of March month, FIIs is a net seller in the cash market and DIIs is a net buyer. In a comparison of buying, selling quantity was huge. Now it is looking like FIIs has taken handover of buying, we wish this handover will continue. Another reason is the American market, this market has shown a good rally in the last four days. Also, the Russia-Ukraine war situation is getting neutral. Meetings are going on to find some conclusion, I hope it will resolve as soon as possible.

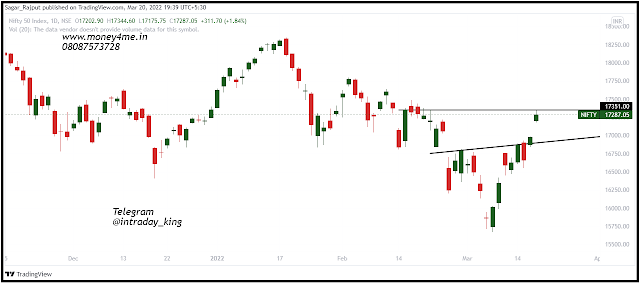
Nifty has shown dip till 15700 and from that bottom taken U-turn with the non-stop rally. On Wednesday, nifty has closed with a small green candle and confirmed Inverted H&S i.e. signal of a trend change. Nifty has given back-to-back breakout to 20 & 200 DMA and now trading near 50 DMA.

I am bullish on Nifty from current levels i.e. 17287, before that expecting one correction till 17000. The good support is 17000 and resistance is around 17350/17500. Our view is long in dips near support or on the breakout.


If we look at the options data then the highest money invested at 17000 PE so we can say that it is good support and call side is 17500. The nifty range is 17500-17000.


Private Banks have shown good buying in the last few days and dragged to bank nifty. However, there is no confirmation of trend change on the chart. Banknifty has three resistances i.e. chart, 200 & 50 DMA and support is around 36000.


In weekly contracts, the highest investment is at 36000 PE and 36500 CE that is the reason PE is good support and CE is resistance for this week.


Telegram: https://t.me/Intraday_King

-------------------------------------------------------------------------------------------------------------------

Disclaimer: The contents produced here are purely for educational purposes. They should not be construed as buy/sell recommendations. I am not a SEBI registered Analyst or Investment Advisor. Readers are advised to consult their Investment advisor before taking any decisions based on the above write-up.


Sunday, March 13, 2022

RELIANCE INFRA – Buy / Sell or Hold?

Friends, in the last write-up we caught two stocks and both are doing well as we expected. Today we found one more multi-bagger stock i.e. RELIANCE INFRA based on chart & fundamentals.

Chart Analysis of RELINFRA: On the weekly time frame, the stock has made on big rounding bottom in between the price range of 6 to 110. This bottom has taken time from June 2019 to June 2021. Then shown the pullback till 60 and made new bottom above previous i.e. higher low. The stock has started up journey after September 2021 and did two time struggle near 110. Finally stock has succeeded to cross the resistance levels of 110 in January 2022 and given confirmation of Rounding Bottom + Bullish Triangle. The breakout candle had good strength and the price went up to 150. After that stock has come down due to the Russian-Ukraine war and global sentiments. In the last week, stock price rise again from trend line support and closed at weekly high levels. The current candle has good strength so we are expecting more up moves till 140 / 150 and support levels are around 110 / 103.


Let’s talk about the company's business and its scope. Reliance Infrastructure Ltd. is one of the largest infrastructure companies engaged in developing infrastructure projects through various Special Purpose Vehicles in several sectors such as power, roads, metro rail, and airport in the infrastructure space and the defense sector. The company is also a leading utility company having a presence across the value chain of power businesses i.e. generation, transmission, distribution, and power trading.

The balance sheet of a company is not good but the company has increased its total assets in the last two quarters. In coming days company business will improve as per our study.


Telegram: https://t.me/Intraday_King

-------------------------------------------------------------------------------------------------------------------

Disclaimer: The contents produced here are purely for educational purposes. They should not be construed as buy/sell recommendations. I am not a SEBI registered Analyst or Investment Advisor. Readers are advised to consult their Investment advisor before taking any decisions based on the above write-up.

Sunday, March 6, 2022

Nifty & Banknifty Range As Per Chart + Option Writing

Friends, Vladimir Putin is playing the role of big bear in all markets. That is the reason we are facing market volatility nowadays. Russia becoming aggressive day by day therefore we are burning in this fire. In this panic situation, we have to avoid a day or short term trading and stick to positional or long term.

Below is the daily chart of Nifty 50, index is trading near 16245 and the overall trend is down. On the 24th of February, the index has broken important support of 16600 and closed at the day low. The next day gap up and closed at day highs. Friday was a gap down and closed neutral after high volatility. As on chart, the coming week's range is 16000 and 16500. However, we have to keep eye on War News because that is impacting more right now.


Below are the top 15 PUT option strike prices where the highest money is invested. As per this PE data, Nifty has good support of 16250/16150, but selling percentages are very low. So we cannot consider these as strong supports.


The CALL writing data is not too strong, only three strike prices are having selling between 1-2%. As per the data resistances are 16300/16400. For this week range is very narrow which is 16400-16100.


The below chart shows us that the bank index has tested the crucial support of 34094 and made a high around 35097. After the zic-zac session index closed near the opening price and the match was a tie. The range for the coming week is 34000 and 35000.


As per PUT option writers, below highlighted are support levels and the highest invested cost is at 34000.


CALL writers are saying every step is resistance i.e. 34500/34600 up to 35000.


Above is all about what charts and options data are saying, but our priority should be Vladimir Putin J.

Telegram: https://t.me/Intraday_King

-------------------------------------------------------------------------------------------------------------------

Disclaimer: The contents produced here are purely for educational purposes. They should not be construed as buy/sell recommendations. I am not a SEBI registered Analyst or Investment Advisor. Readers are advised to consult their Investment advisor before taking any decisions based on the above write-up.

---------------------------------------------------------------------------------------------------------------------------------